Bitcoin Gold Blockchain Performance
We’re going to share some details and analysis of our blockchain’s performance. Although our Ecosystem has been growing rapidly, we know a few parties (including a small number of exchanges) were waiting to see if the new “blockchain is stable.” With this post, we plan to lay out what we feel is compelling evidence about that and hope to explain some possible misunderstandings.
Background
The key element here is the Bitcoin Gold blockchain, which is maintained by an independent network of thousands of computers doing calculations to process and secure transactions. Just like the Bitcoin and the Bitcoin Cash blockchains, the BTG blockchain is designed to produce blocks at an average interval of ten minutes, but the actual time to find any particular block is a random distribution, based on a “race” between those thousands of computers. A block might be found in two minutes, but might take twenty. It’s the average time that matters.
Our network’s block generation rate has been steady, finding new blocks as planned after the expected burst in the first 24 hours after MainNET Launch. After public mining began, the per-block Difficulty adjustment algorithm ratcheted up the Difficulty rapidly in response to a massive influx of mining hashpower, eventually stabilizing the average block find time at the target 600 seconds (ten minutes.)
Since then, the overall network Hashrate has been fluctuating significantly, as should be expected – the market for GPU hashpower is competitive, and responds rapidly to changes in market prices of multiple different cryptocurrencies. Our Difficulty adjustment algorithm quickly compensates for these conditions and has maintained an average time to find a block that is very close to the 600-second target.
Variability in Hashrate and the Difficulty Setting
It’s a mistake to focus on fluctuations in the actual Hashrate and the Difficulty: a varying Hashrate is entirely expected, and the changing Difficulty is designed specifically to compensate for the varying Hashrate. This is how the BTG blockchain produces a relatively constant block find time despite a fluctuating GPU hashpower market.
It’s important to recognize that changes in Difficulty are just a means to an end: what matters is the time to find blocks. It is explicitly because our Difficulty responds rapidly that none of the following problems have been occurring:
- a drop in block time, due to incoming hashpower, which happens when BTG price rises or prices fall
- an increase in block time, due to outgoing hashpower, which happens when BTG price falls or other prices rise
- any dramatic change in block times when a significant amount of hashpower enters or leaves, whether based on whim or malicious intent
We’re pleased that our adjustment algorithm (a variant of Digishield V3) has been so efficient. Some might recall that we adjusted the algorithm during the Testnet period in early November. We considered it critical to get the adjustment algorithm working right – not to do so would be careless and could be harmful to other coins in the ecosystem. Bitcoin Gold always strives to be a Friendly Fork, so we’re pleased to have had no adverse impact on our predecessor coin, Bitcoin.
We’ve also become aware that some people have the mistaken notion that our block times are not stable because, quite frankly, they’ve seen some new charts they’re not familiar with! Traditional blockchain explorers graph the average time per day for Bitcoin and for Bitcoin Cash (one day is roughly 144 blocks), but some of the new explorers for Bitcoin Gold are reporting the find time per block. This new reporting made sense – after all, the Bitcoin system only adjusts the Difficulty once every 2016 blocks (about two weeks), so showing the daily average is fine. The Bitcoin Cash system added an EDA (Emergency Difficulty Adjustment) to compensate for fluctuations but was still based on a two-week adjustment. It was only after Bitcoin Gold came along with a per-block adjustment that it made sense to start reporting on a per-block basis.
These two different views – per day averages versus per block reporting – make for very different pictures, and you just can’t compare them. If we compare these three chains directly, using the same method for all, we’ll see that Bitcoin Gold does well.
Some Hard Data: Scatter Plots
Here are three scatter plots – The first is original Bitcoin, the second is Bitcoin Cash, and the third is Bitcoin Gold. All three chains have a target Difficulty of 10 minutes (600 seconds), and all three have the same timescales. Each dot represents the time to find one particular block, and the black line shows a 72-block moving average. (With a ten-minute target, 72 blocks should be about 12 hours.)
(Note: the vertical scale is limited to 1200 seconds to make fluctuations in the average block time clear. All three blockchains have significant numbers of outliers well above 1200 seconds which are not shown here, but they are included in the averages.)
What’s a scatterplot? Each dot represents how long it took to find one block. A dot at height 120 means that block took 120 seconds (two minutes) to find, and a block at 1,200 took 20 minutes to find. Every block goes into the scatterplot.
The black line shows the average time of the preceding 72 blocks. Since the process is intended to take about ten minutes per block, the black line should average around 600 seconds. So while the dots show you actual block times, and the black lines show you if the average has been running high, or low. (Ten minutes times 72 blocks should be twelve hours, so the black line is a kind of twelve-hour average.)
These plots of the block times and line graphs of the average time show that Bitcoin, Bitcoin Cash, and Bitcoin Gold are all exhibiting typical variability, but their averages are hovering around the 600-second target. Bitcoin is a touch more stable than the other two coins; this is likely a natural result of the fact the Bitcoin usually has more miners working on it than the other two currencies.
Although we’ve been stable for these two weeks, some people might ask why we don’t show the entire period since launch. It’s a fair question. There are two reasons: firstly, we had a very rapid series of blocks in our first day, both from establishing the Endowment and from the ramp-up afterward as massive new distributed hashpower came into our network. (Remember that we were not a live split at fork time which would capture a share of existing Bitcoin hashpower – our new network stood up from scratch, so after Launch, it needed to start from zero.) So it took a little time for our blockchain to stabilize.
The second reason: a few hours after our launch, on November 13th, Bitcoin Cash performed a hard fork to modify their Difficulty adjustment algorithm, and their network also needed time to stabilize. Using the first few days of our launch would not be fair to either Bitcoin Cash or to Bitcoin Gold.
In the end, we feel that these two weeks paint a fair picture of the current state of all three of these blockchains. However, to be comprehensive and transparent, we’re also publishing two more scatter plots covering earlier periods.
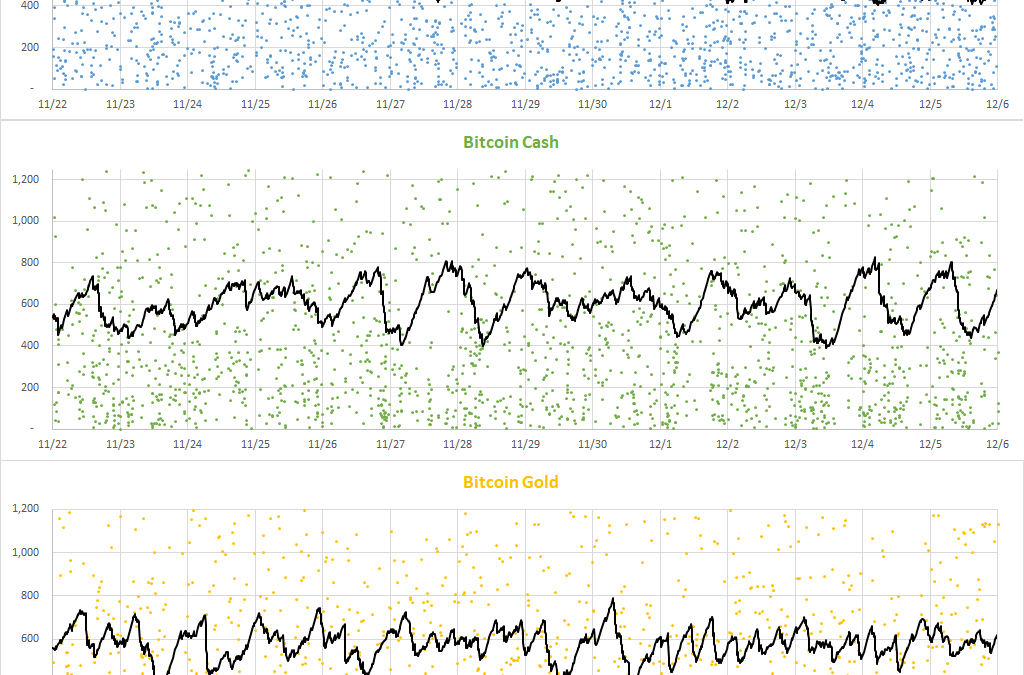
The second plot shows the time of our Launch, along with the ten days before and the ten days after, for 21 days, total. The vertical scale (seconds) has been increased to capture the broader fluctuation range of the 12-hour moving average in this period.
Above, you can see that the Bitcoin Gold blockchain started with a low Difficulty, and rapid blocks, followed by a quick rise as the system brought the network towards a 10-minute average despite a massive influx of hashpower after pools pointed their miners at the network.
Bitcoin Gold uses GPU miners, so it doesn’t affect Bitcoin. The GPU mining market is competitive and varies, too, but our per-block Difficulty adjustment compensates for these fluctuations.
Lastly, to help show the “big picture,” this last chart shows the entire lifespan of Bitcoin Gold, starting one week before the fork (the gold-colored point in the Bitcoin plot on October 24th is the forked block), and running all the way through December 6th.
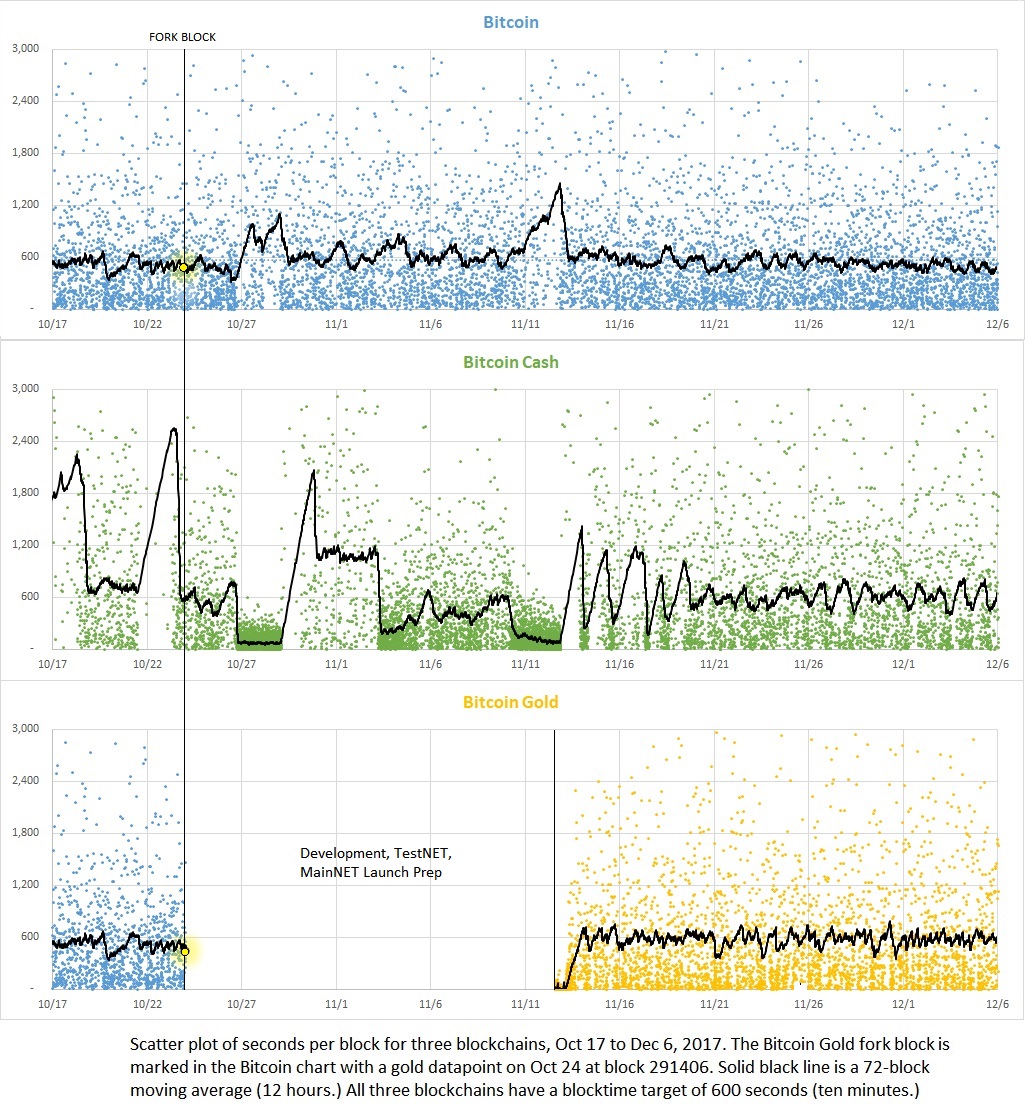
Again, the vertical scale has been adjusted to account for higher peaks on moving averages.
The raw data for these scatter plots is publicly available, becasue each blockchain contains the timestamps. They are available here as a CSV for convenience for those who would like them – and please let us know if you have questions or comments.
We hope this helps clarify any misunderstandings and makes quite clear that the Bitcoin Gold Blockchain is Stable, and has been a Friendly Fork.
Thanks for reading!
Sincerely,
The Bitcoin Gold Community
#1CPU1Vote
All rights reserved Bitcoin Gold